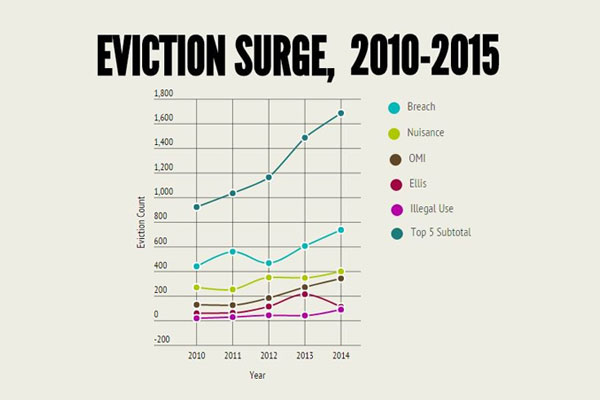
We are reading more and more stories of evictions in the local news. What frequently isn’t reported in the news are the cold, hard numbers about eviction in San Francisco.
Behind these number are the evictions that are happening to you, your sister, your friend, or your neighbor. These evictions are not sensationalized enough to generate news coverage, but are still painful and life-disrupting.
A hard look at the numbers
One of the best sources of eviction trends in San Francisco is provided by the Anti-Eviction Mapping Project, one of my favorite sites. They show visually what’s happening all across the City.
In 2015, the Anti-Eviction Mapping Project published a report by the S. F. Anti-Displacement Coalition, a group of 27 organizations in the city, most of which provide direct services to tenants and the homeless.
Number of evictions way up
This report looked at five years of eviction trends from 2010 to 2015. The number of evictions are up. Anyone who’s read the news or been involved with helping tenants like me knows that.
But the most startling fact is that from 2010, they were up 54.7%.
Not all evictions are counted
The San Francisco Rent Board statistics show 8,619 evictions from 2010 to 2015. However, as the report notes, there are many evictions that are unreported to the Rent Board. Many evictions are done without a formal notice to quit.
I’ve written in an earlier blog about a landlord informing you in a “friendly manner” that he is moving into your unit. If you move because of this, it’s really a form of non-formal eviction. These type of evictions aren’t included in the Rent Board’s statistics.
Evictions as a percentage of the population
As Keith Spencer in the Bold Italic noted with the City having a population of about 900,000, that would be about 1% of the population that has been evicted.
The real number of people evicted is even more. One eviction notice goes out to one unit. Many tenants have more than one person living in their home. The number of actual people affected by eviction is really much higher.
So the actual number of evictions are bad. The numbers, if they included unreported evictions and the total number of actual people who have been evicted, are even worse.
The top reasons for evictions
The S. F. Anti-Displacement Coalition report states the top five categories of eviction notices. These are not surprising:
- Breach of lease
- Nuisance
- Owner Move-in
- Ellis Act
- Alleged illegal use, like Airbnb renting
Altogether, the number of notices of these five categories have increased 82.5% from 2010 to 2015.
Of these categories, the breach of lease has risen the most dramatically. I find that many of these evictions from my clients are be tied to violating the “House Rules.”
Landlords use your alleged noncompliance with the “House Rules” as a tool to evict you. Drying laundry out the window or on the back porch? Leave your stroller in the hallway? If these are against the “House Rules,” you could be evicted under a Breach of Lease.
There are ways to fight this type of eviction. I advise my clients to be proactive when they received a change in the “House Rules.” I covered my suggestions in an earlier blog called “Fight Your House Rules Eviction.”
Last six months
The S. F. Anti-Displacement Coalition report used information available as of April, 2015. Based on the number of stories in the news, it’s gotten a lot worse. The number of evictions for the last six month agree.
The San Francisco Rent Board uses their fiscal year as a basis for reporting evictions. That means their reporting is from the month of July through June. They do publish monthly statistics, and as of the date I write this blog, the statistics for November 2015 are the most recent month available. The number of evictions for 2015, which will include December, won’t be available until sometime next month.
For the last six months of the data that’s available, there are 1,104 reported evictions. If the last six month’s figure is doubled, that’s 2,208 evictions. When will this trend stop?
Top five reasons
A closer look at the types of evictions of the top five categories shows that Breach of Lease is still the all-time favorite way to get an eviction. Here are the categories, as a percentage of total evictions:
- Breach of lease: 32%
- Nuisance: 15%
- Owner Move-in: 17%
- Ellis Act: 5%
- Alleged illegal use: 5%
Overall these top five reasons count for 74% of the total eviction notices. That’s a staggering figure.
The news is true
We’ll know more once the Rent Board publishes the December data. But we already know that evictions are up, not just because the news is following more stories. The numbers prove it’s really happening, and it happening all around us.
If you are being evicted?
Are you being evicted? Do you know what to do? You may consider calling an experienced tenant attorney who can help you protect your tenant’s rights.
Know your rights. Protect yourself.


 (415) 533-0735
 (415) 843-0496